AMI 2.0: From Promise to Proof. Rhode Island Shows What That Means.
The next generation of AMI can deliver new value from the infrastructure utilities are already putting in the field.

For years, utilities have been making enormous investments in advanced metering infrastructure with the promise that smarter meters will deliver greater value to both utilities and their customers. That promise is now a reality.
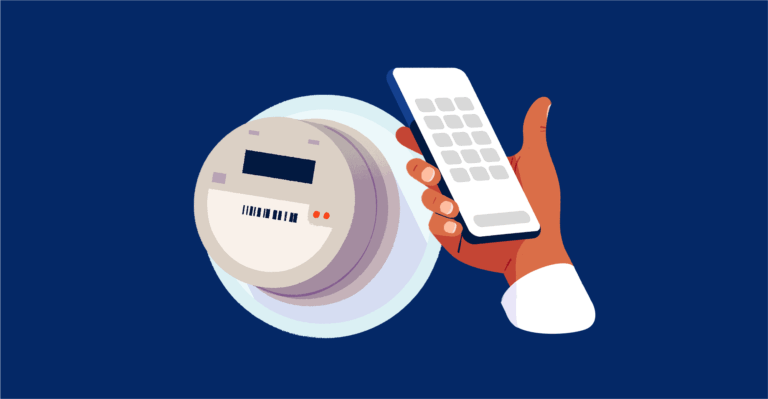
Earlier this month, Rhode Island Energy and Sense announced that customers with new advanced meters can access their electricity use in real time through the Sense app. There is no additional Sense hardware to purchase or install. The experience is enabled through the Landis+Gyr Revelo meters Rhode Island Energy is deploying across its service territory, making this one of the earliest live deployments of a real-time consumer energy application through AMI 2.0 infrastructure.
That may sound like a consumer app announcement. But for the utility industry, it represents something bigger: tangible proof that the next generation of AMI can deliver new value from the infrastructure utilities are already putting in the field.
From meter reading to a more advanced platform
The first generation of AMI largely digitized a function utilities were already performing: measuring electricity consumption. Instead of sending someone to read a meter, utilities could receive interval data remotely. That was valuable. But it left much of the underlying model unchanged.
This next generation of advanced meters can do much more. Platforms such as Landis+Gyr’s Revelo combine increasingly sophisticated sensing, computing, and communications capabilities and are able to run software like Sense. This ability to run software is the key: previous AMI meters served as data collection devices. Meters are at the edge of the distribution grid and by enabling software to run on the meters, we can create the distributed intelligence needed to better manage the grid going forward. This is the definition of AMI 2.0.
The notion of grid edge intelligence is not new, but so far has mainly meant collecting data from the edge (15-minute interval data from AMI 1.0) and processing it centrally. The reason distributed processing matters so much is not really based on where the software runs; it is actually driven by the data. The meters being deployed in Rhode Island are processing 50 million times more data than the 15-minute interval data available in the past. There is of course no practical way to send 50 million times more data and process it centrally – with AMI 2.0 we are able to process the data locally and only send relevant data over communication networks.
The other key advantage of AMI 2.0 is the ability to provide real-time applications. The Sense consumer app that Rhode Island Energy has made available to its customers provides a real-time view into energy use in the home. This allows consumers to associate what they see in the application with activity in their home (they can turn something on or off and see it in the application). Consumers have never had this sort of visibility without installing specific energy monitoring products in their homes.
AMI 2.0 is now live – why this matters
The technical specifications for AMI 2.0 were initially driven by the needs of consumer-facing applications like Sense. In particular, we use a technology called “Load Disaggregation” where our system learns the unique energy patterns of electrical consumption of devices in homes to determine in real time what is on or off in a home and how much power is being consumed. It is a very difficult technical challenge – it is like doing speech recognition with 30 people talking at the same time.
The performance of load disaggregation is very dependent on the resolution of the data available – you can do rough estimates with 15-minute interval data but cannot provide detailed real-time load breakdowns. Even with 50 million times more data, this is a difficult challenge and performance is continuing to improve as we get more and more data. We now have over 700 million hours of high-resolution data and use this to train foundation models that recognize the key patterns in voltage and current waveforms. These foundation models run directly on the latest AMI 2.0 meters and are used to support an increasing range of applications.
The announcement from Rhode Island Energy last week was about deploying this sort of consumer-facing functionality, but now that AMI 2.0 is live, the impact is going to be much bigger.
Meters are at the intersection of homes and buildings and the grid – so truly at the edge of the grid. The same technology which can analyze electrical waveforms to see inside homes and buildings can also see in the other direction. If vegetation hits a power line or arcing happens in a service feed, and this disrupts the voltage waveforms even by a very small amount, we see it in our software in the meter. If we see one of these voltage anomalies in one meter, our foundation models can tell some things about the cause – but if we see it from all meters at once, we are able to provide details about the cause and location.
In addition, by knowing the real-time load profile at each home, if our models know the topology of the network (which we can figure out from the data), we are able to trace all the way up and know the real-time power flow of the grid.
A different way to think about AMI investments
Utilities are facing a unique and growing set of challenges: how to support load growth in an affordable and reliable way. AMI 2.0 can support these challenges by making the grid smarter – at the edge.
By providing consumers with real-time applications, utilities can give consumers direct ways to save money. The most direct is of course by finding ways to reduce their energy consumption, but increasingly it will be about shifting the timing of energy consumption (including through automation) to take advantage of time-of-use rates or other incentives.
And, to more fundamentally control costs, the key to unlocking load growth without increasing rates is of course better matching supply and demand in the grid. Large capital investments are underway or being planned to support load growth (especially to support data centers) – and costs are mainly driven by peaks throughout the electrical grid. With AMI 2.0 and the ability both to track real time power flow throughout the grid and influence the timing of at least some of the loads, peaks can be handled without large capital investments.
Finally, with increased reliance on the grid and more frequent weather events, reliability and safety are becoming increasingly important. The ability to continuously monitor the grid for risks and failures will be key to improving safety and reliability while keeping operating costs under control. AMI 2.0 will be one of those sources of continuous monitoring – and the only one which goes all the way to the edge of the grid.
Rhode Island Energy is showing what this model looks like in practice. The customer sees an app. Underneath it is something far more consequential: a new model for turning advanced metering infrastructure into a platform that can keep delivering new value long after the meter is installed.