We know you care about the environment and want to reduce your carbon footprint. You recycle, you’ve started to use energy efficient appliances in your home, and perhaps you drive an EV. But you can amplify your impact if you have clearer insight into where your electricity provider is getting the energy you use. If you could know when your electricity provider relies on a higher percentage of fossil fuels, you can choose to postpone some tasks (laundry, for example, or charging that electric car) until your power is coming from cleaner energy sources.
Your electricity provider works through the day, every day, to balance supply with demand as consumer use fluctuates.
Wind and solar are completely renewable but production can vary due to weather (and time of day), so they can be less reliable during peak usage periods. This means the utility provider must rely on other sources to avoid brownouts or full outages.
Fossil fuels can be reliable, but they are expensive to produce, including the “cost” of greenhouse emissions, which are often limited by Federal and State government regulations.
So electricity providers use a mix of different energy sources, which can vary not only day by day but hour by hour. In 2023, the overall mix looked like this:
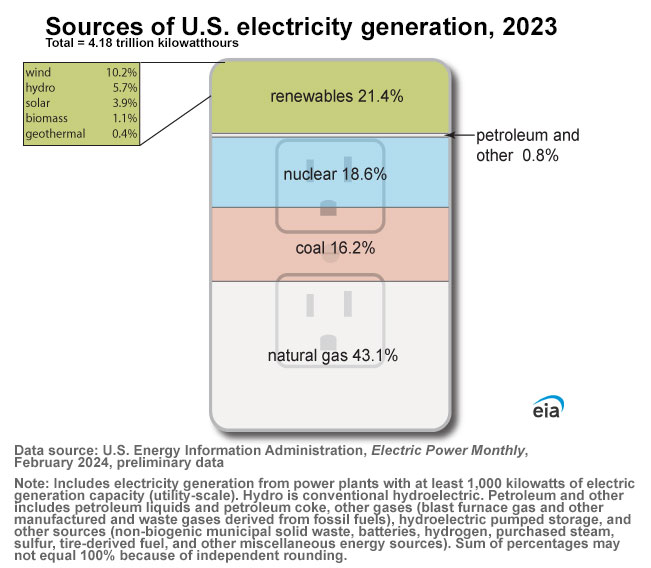
Approximately 60% of the energy produced in the US comes from fossil fuels (coal and natural gas), but the use of renewable energy sources has risen from 12% in 1990 to just over 20% in 2023, and should reach 25% of all energy produced by 2026. This is good news for all of us, as renewable energy has a much lower carbon intensity than does energy produced by burning fossil fuels, which means it produces significantly less greenhouse gas emissions.
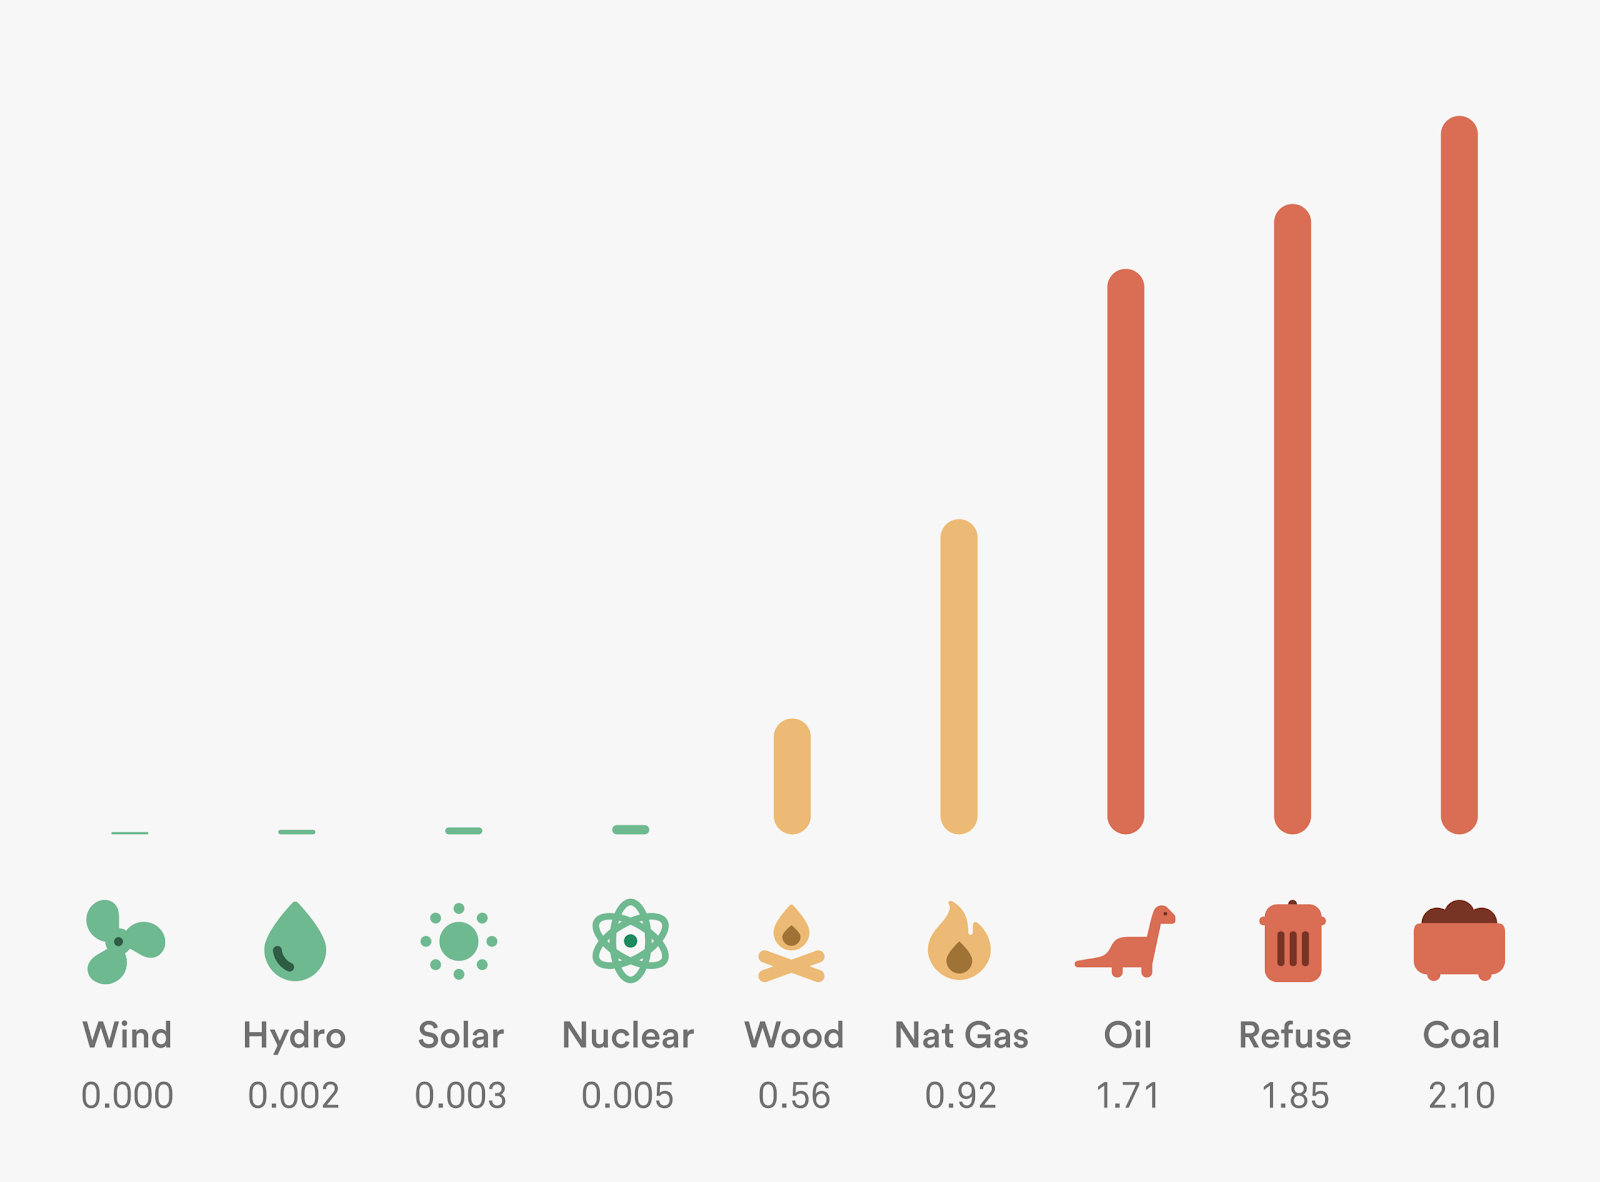
Carbon intensity rates
During the peak period from late morning to evening, a utility company’s energy mix typically includes the highest percentage of fossil fuels. This then reveals a good time for all of us to try to conserve electricity.
Sense Carbon Intensity reports show you the mix in use by your electricity provider, day after day, and hour by hour. To help you save money and reduce greenhouse emissions, you will want to choose, when possible, to hold off on using some of your heavy load appliances until the mix has a lower reliance on fossil fuels.
How Sense Can Help You
The Sense Home app can help you understand your electricity provider’s mix and let you make informed choices on your home’s energy use. Just go to your Dashboard and scroll down to the Carbon report.
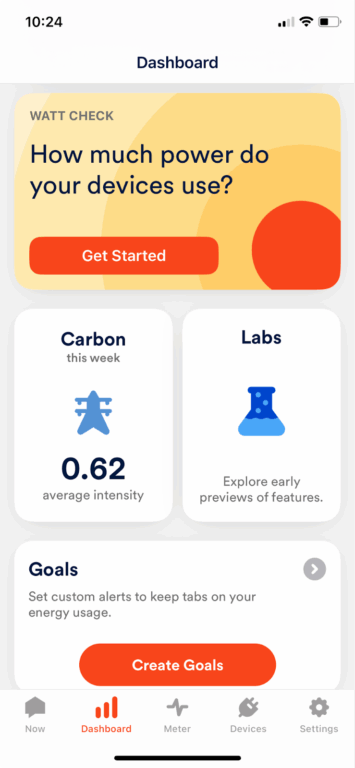
This electricity provider, delivering power near Sense headquarters in Massachusetts, is operating at approximately the national average for carbon intensity at 0.62%. At least on this day. If you click on this Carbon report, you’ll get to the Carbon Intensity report, which details how the use of fossil fuels varies throughout the day:
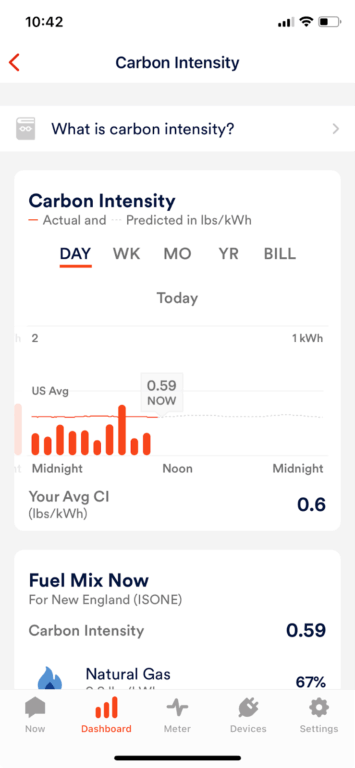
If I swipe right, I can see yesterday’s full day report (another weekday). This offers better insight into when carbon intensity is highest, which correlates to when demand is highest.
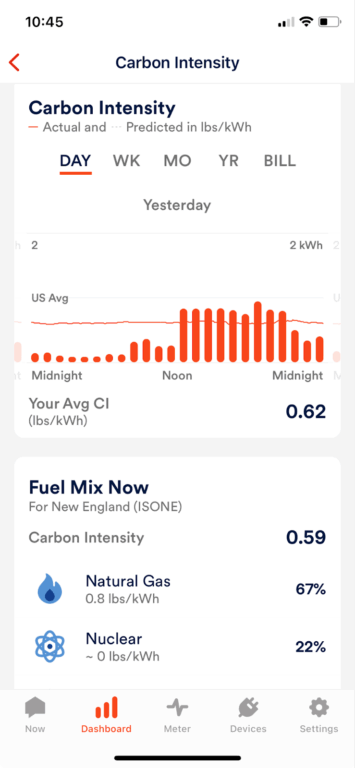
To see exactly how my utility is sourcing energy, I can continue to scroll down to see the Fuel Mix Now report (whose mix will vary throughout the day and night and from day to day).
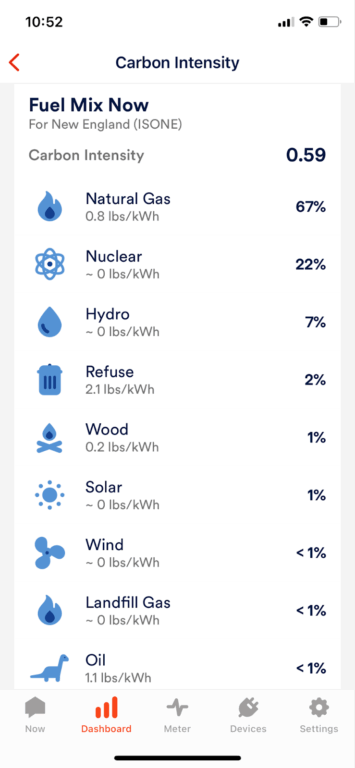
Note that the carbon intensity is roughly at the national average of 60%. The details provide interesting information as well.
– This screenshot was taken on an overcast day with almost no wind, so there is little option for this utility to use solar or wind renewables. On a different August day, their use will increase and change this mix.
– Use of fossil fuel matches the average but is based almost solely on natural gas, which has a lower carbon intensity than coal or oil (see table above).
– Nuclear sources provide 20% of the mix. Nuclear energy has a very low carbon intensity.
– As you see, biomass (wood, landfill gas and refuse) are in use more than solar or wind, the more familiar forms of renewable energy. As noted above, biomass options are renewable but also costly and release greenhouse gasses, though less than the burning of fossil fuels.
This is only a snapshot. Yesterday’s results were different, as would be results viewed at 3:00 AM or some other period of low power demand overall, when fossil fuels can be used less. Increasingly, utility companies are also charging more for peak “Time of Use” periods. If your utility is charging different rates for different times of the day, you can also use your Sense Home app to set and track those rates.
All this shows that your electricity provider uses a lot of energy generated using fossil fuels during the highest usage portions of the day. It also reinforces why it’s best for us to try to postpone our use of big items, when possible, to non-peak periods. So if we run the dishwasher before we go to bed, or wash and dry laundry in the early morning, we will save energy and money.
Your family’s choices to reduce energy use during periods when the utility relies most on costly and polluting fossil fuels will significantly help the planet and reduce your monthly electric bill. And the cost of each source in a utility’s mix can vary widely, so depending on how much, how often, and when your home uses electricity there may be a notable impact on your monthly bill. If you are working to save energy, as well as money, your awareness and choices can help on both fronts.
