preview
Carbon Intensity Overview
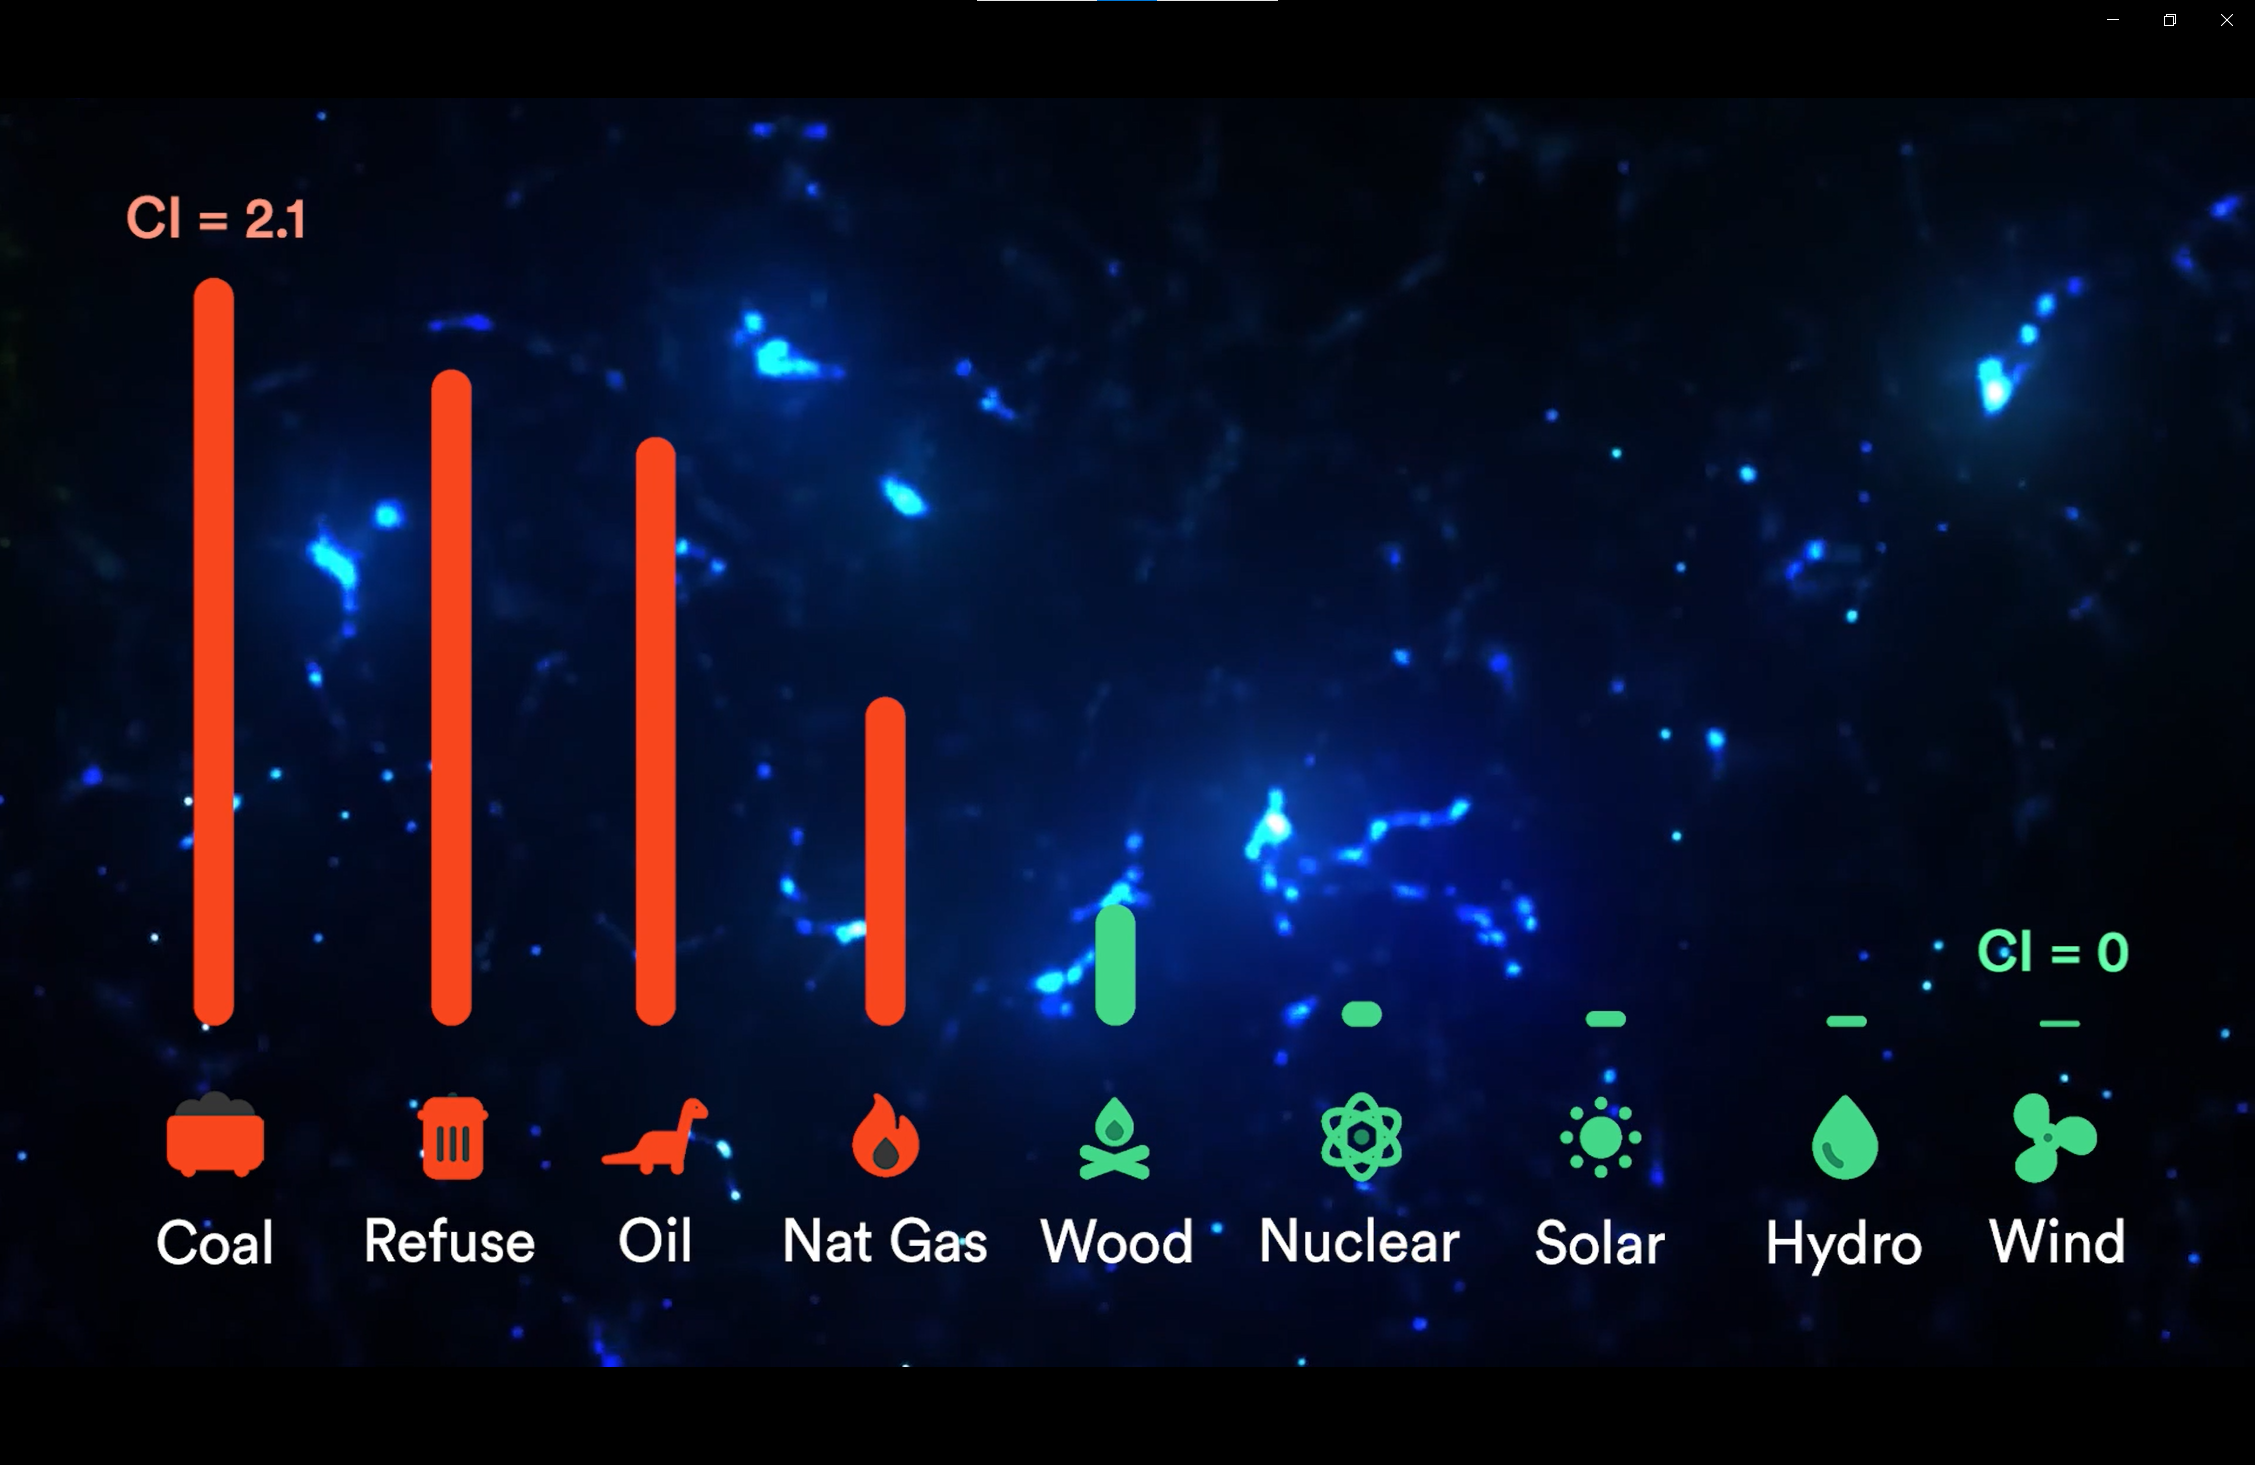
Depending on where you live, the energy your home uses comes from a mix of sources. These sources emit different amounts of carbon emissions, as measured by their carbon intensity.
Select a region CAISO
Natural Gas: 0.920
Import: 0.940
Solar: 0.003
Wind: 0.000
Hydro: 0.002
Nuclear: 0.005
Geo: 0.200
Wind: 0.000
Coal: 2.100
Natural Gas: 0.920
Nuclear: 0.005
Hydro: 0.002
Coal: 2.100
Natural Gas: 0.920
Nuclear: 0.005
Wind: 0.000
Average Regional Fuel Mix The Carbon Intensity of each fuel ranges from 0.000 to 2.1, which equates to the pounds of carbon to produce one kWh of electricity. Graphic shows the average Carbon Intensity (CI) of each region (over a 12-month period).
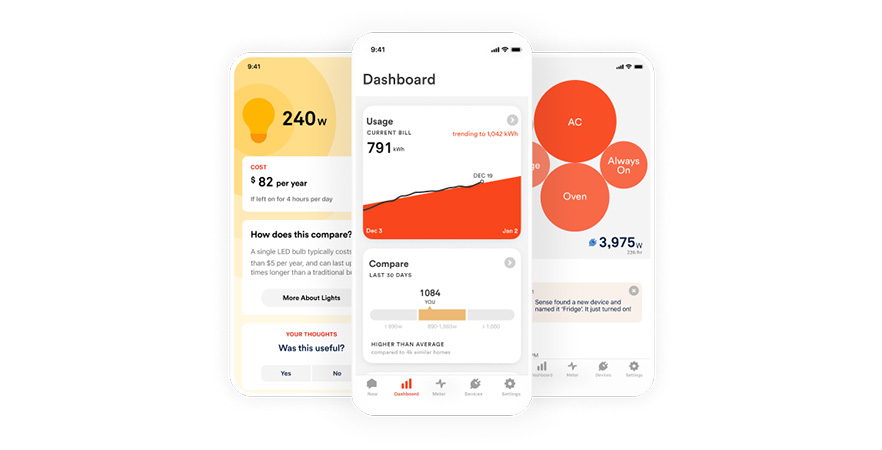
The Carbon Intensity feature shows your region’s CI number in real time.
And provides a forecast, so you can plan your high energy tasks when carbon emissions are lowest.
Use your high energy devices when the CI number is low.
And power down your energy hogs when the CI number is high.
Compare your energy usage to the CI line to see how well you’re doing.
It’s one way you can have a personal and meaningful impact on climate change. And that’s the gist. Got it? Want to learn more?
US Average 5 kWh 5 kWh 12 am Noon 12 am
Your Avg CI (lbs/kWh)
0.32
The Carbon Intensity feature shows your region’s CI number in real time.
And provides a forecast, so you can plan your high energy tasks when carbon emissions are lowest.
Use your high energy devices when the CI number is low.
And power down your energy hogs when the CI number is high.
Compare your energy usage to the CI line to see how well you’re doing.
It’s one way you can have a personal and meaningful impact on climate change. And that’s the gist. Got it? Want to learn more?
What is carbon intensity?

Carbon Intensity (CI) is the amount of carbon dioxide emitted to generate a specific unit of power. We measure CI in pounds per kWh, and the number ranges from close to 0 up to approximately 2 lbs/kWh. The average CI across the U.S. is 1, which is close to the CI score for natural gas. The higher the number, the higher the carbon emissions and related environmental impact.

How are carbon intensity and fuel mix related?

Carbon intensity varies depending on the fuel sources that utilities use to generate energy over the course of a day or week. In the Sense app, you see the aggregate score for all the fuel sources in your region at any given point in time, as well as the proportions of each fuel in the mix. The CI score varies dynamically; for instance, if the grid is using coal, the carbon intensity will be higher than if power is generated mostly by natural gas or solar.

Where does the carbon data come from and how often is it updated?

We are using Singularity Energy’s Carbonara platform to provide carbon intensity data every 5 minutes.

Is carbon data available in all areas?

Sense uses grid-emission data provided by regional balancing authorities across the U.S. Many of these regions report data in five-minute intervals, but others have a significant delay. Today, the Carbon Intensity feature is only available for regions that report data in nearly real-time. They include: Bonneville Power Administration (BPA), California Independent System Operator (CAISO), Southwest Power Pool (SPP), Midcontinent Independent System Operator (MISO), PJM, New York Independent System Operator (NYISO), and ISO New England (NEISO).

How does the Carbon Intensity feature work with community solar or clean energy programs through my utility?

Community solar and clean energy programs use carbon offsets to reduce the subscriber’s overall carbon emissions, but electricity is still delivered by the utility provider. When you use a kWh of electricity, it’s being generated by the fuel sources that are powering the grid at that moment. Even if you participate in a clean energy or solar program, the Carbon Intensity feature can help you reduce your carbon impact by using energy when the least carbon intensive fuel sources are powering the regional electricity grid.

What if I have solar?

The carbon intensity feature does not account for your solar system production. It focuses on energy that’s being produced by the grid.